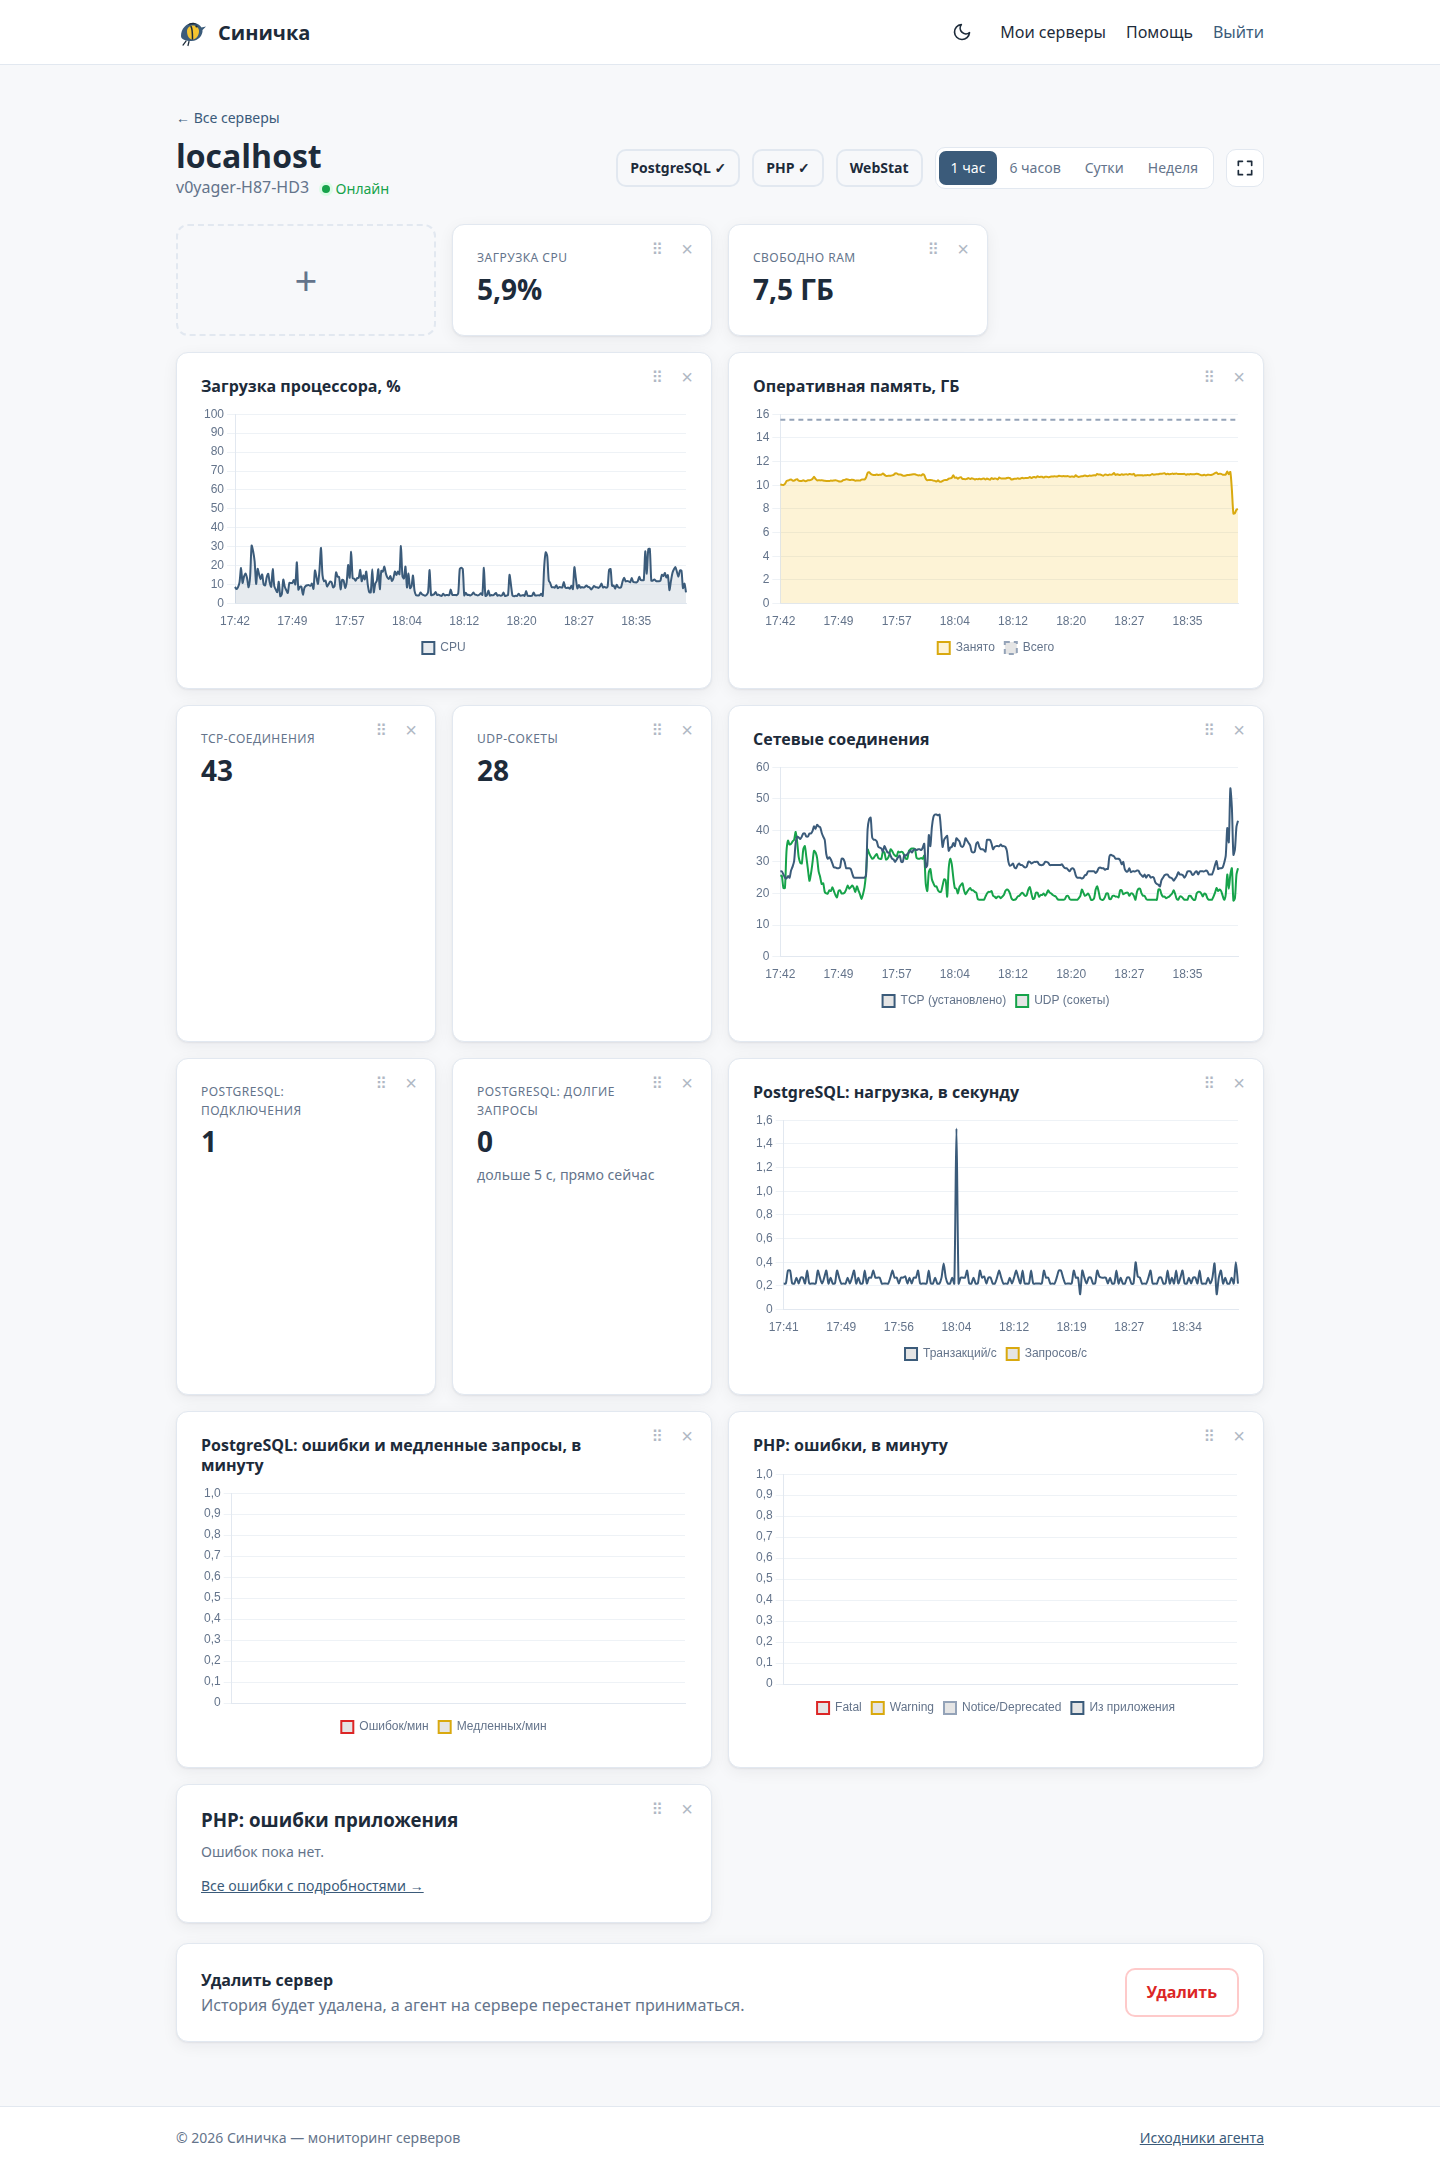
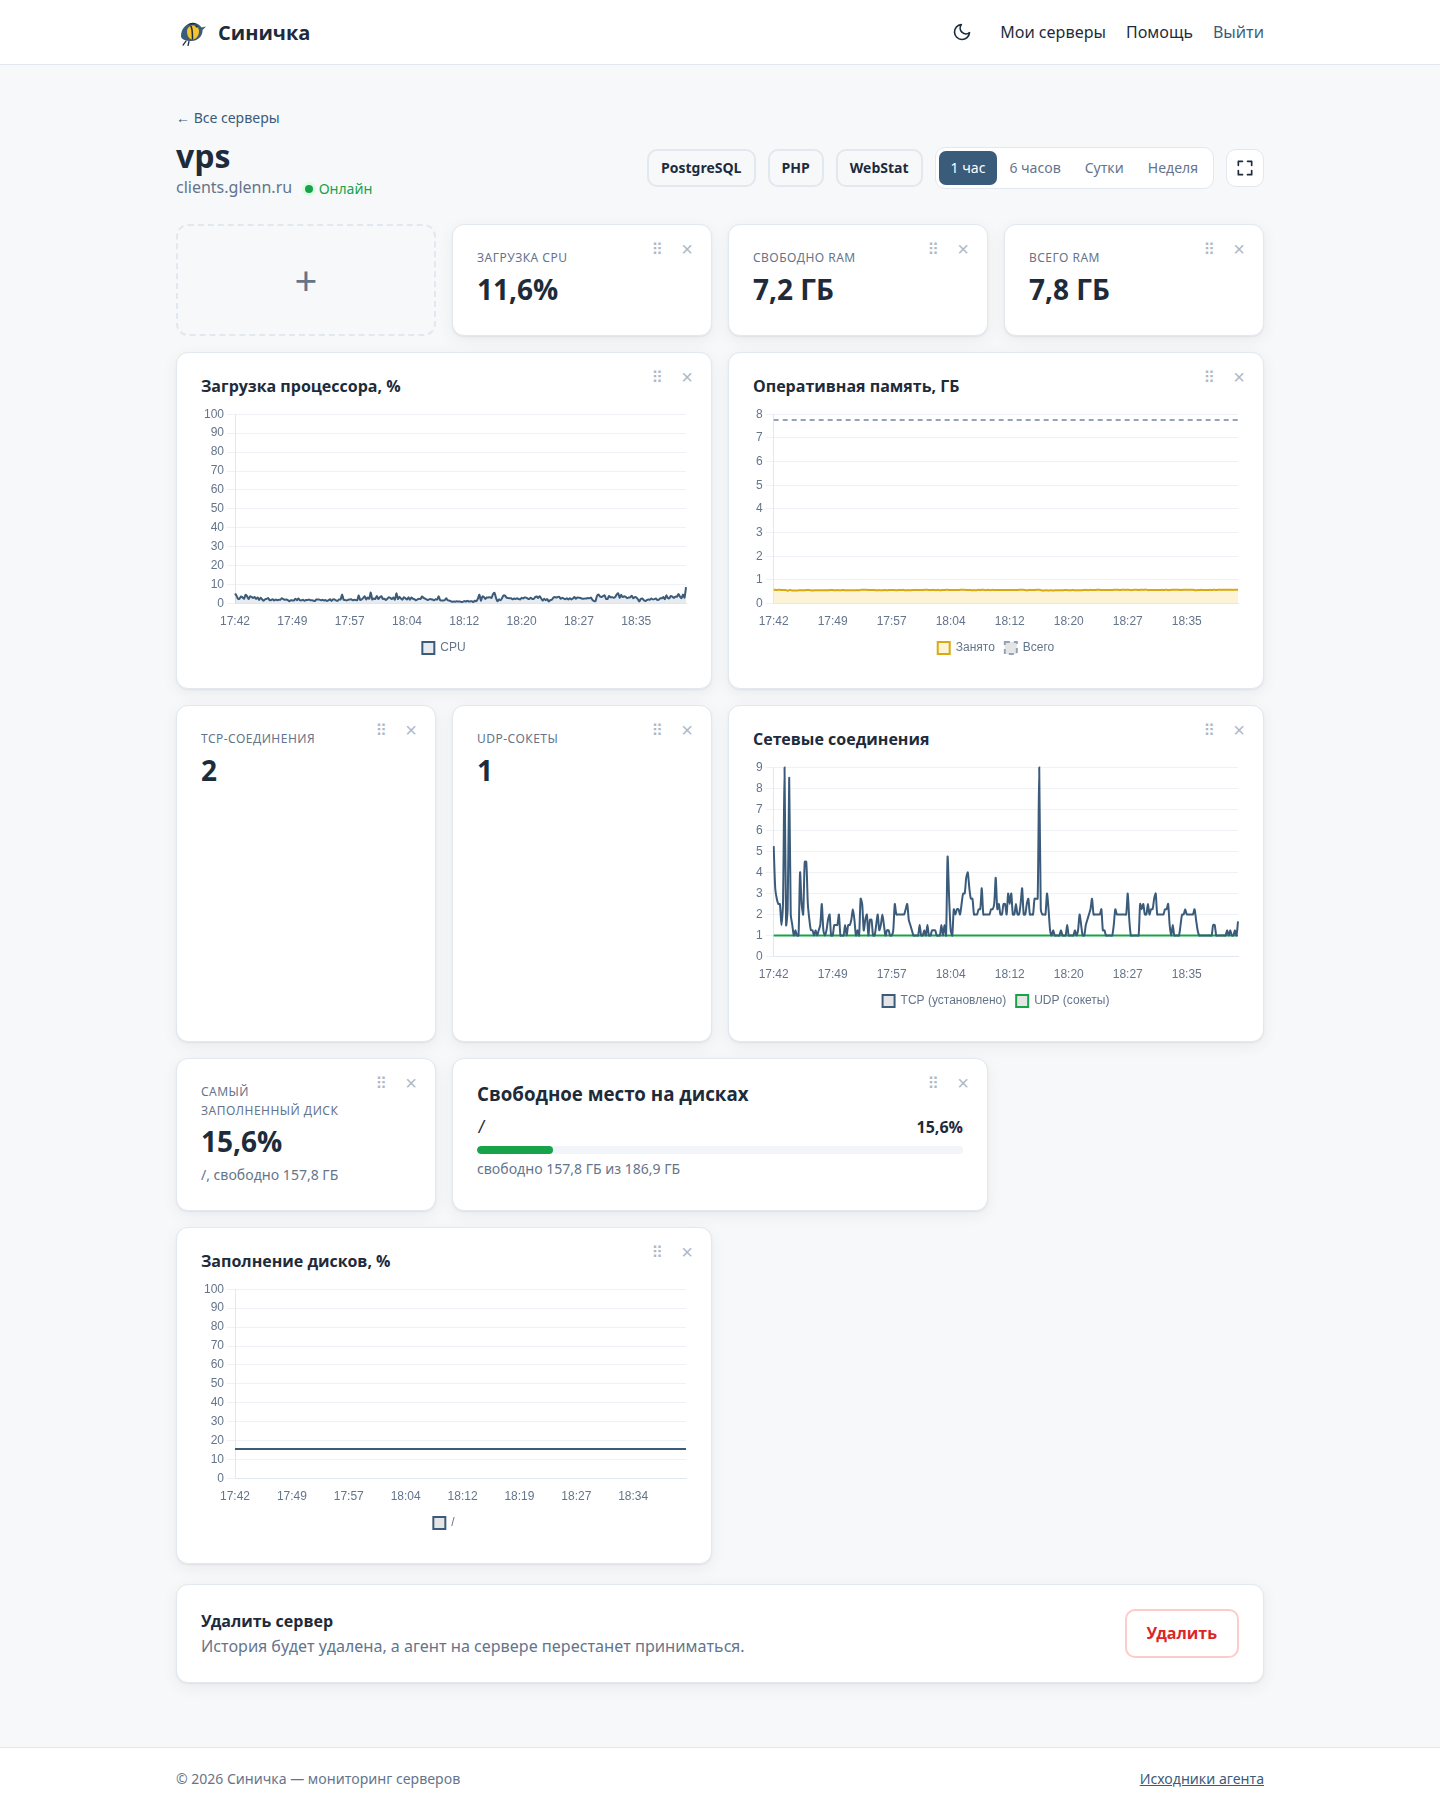
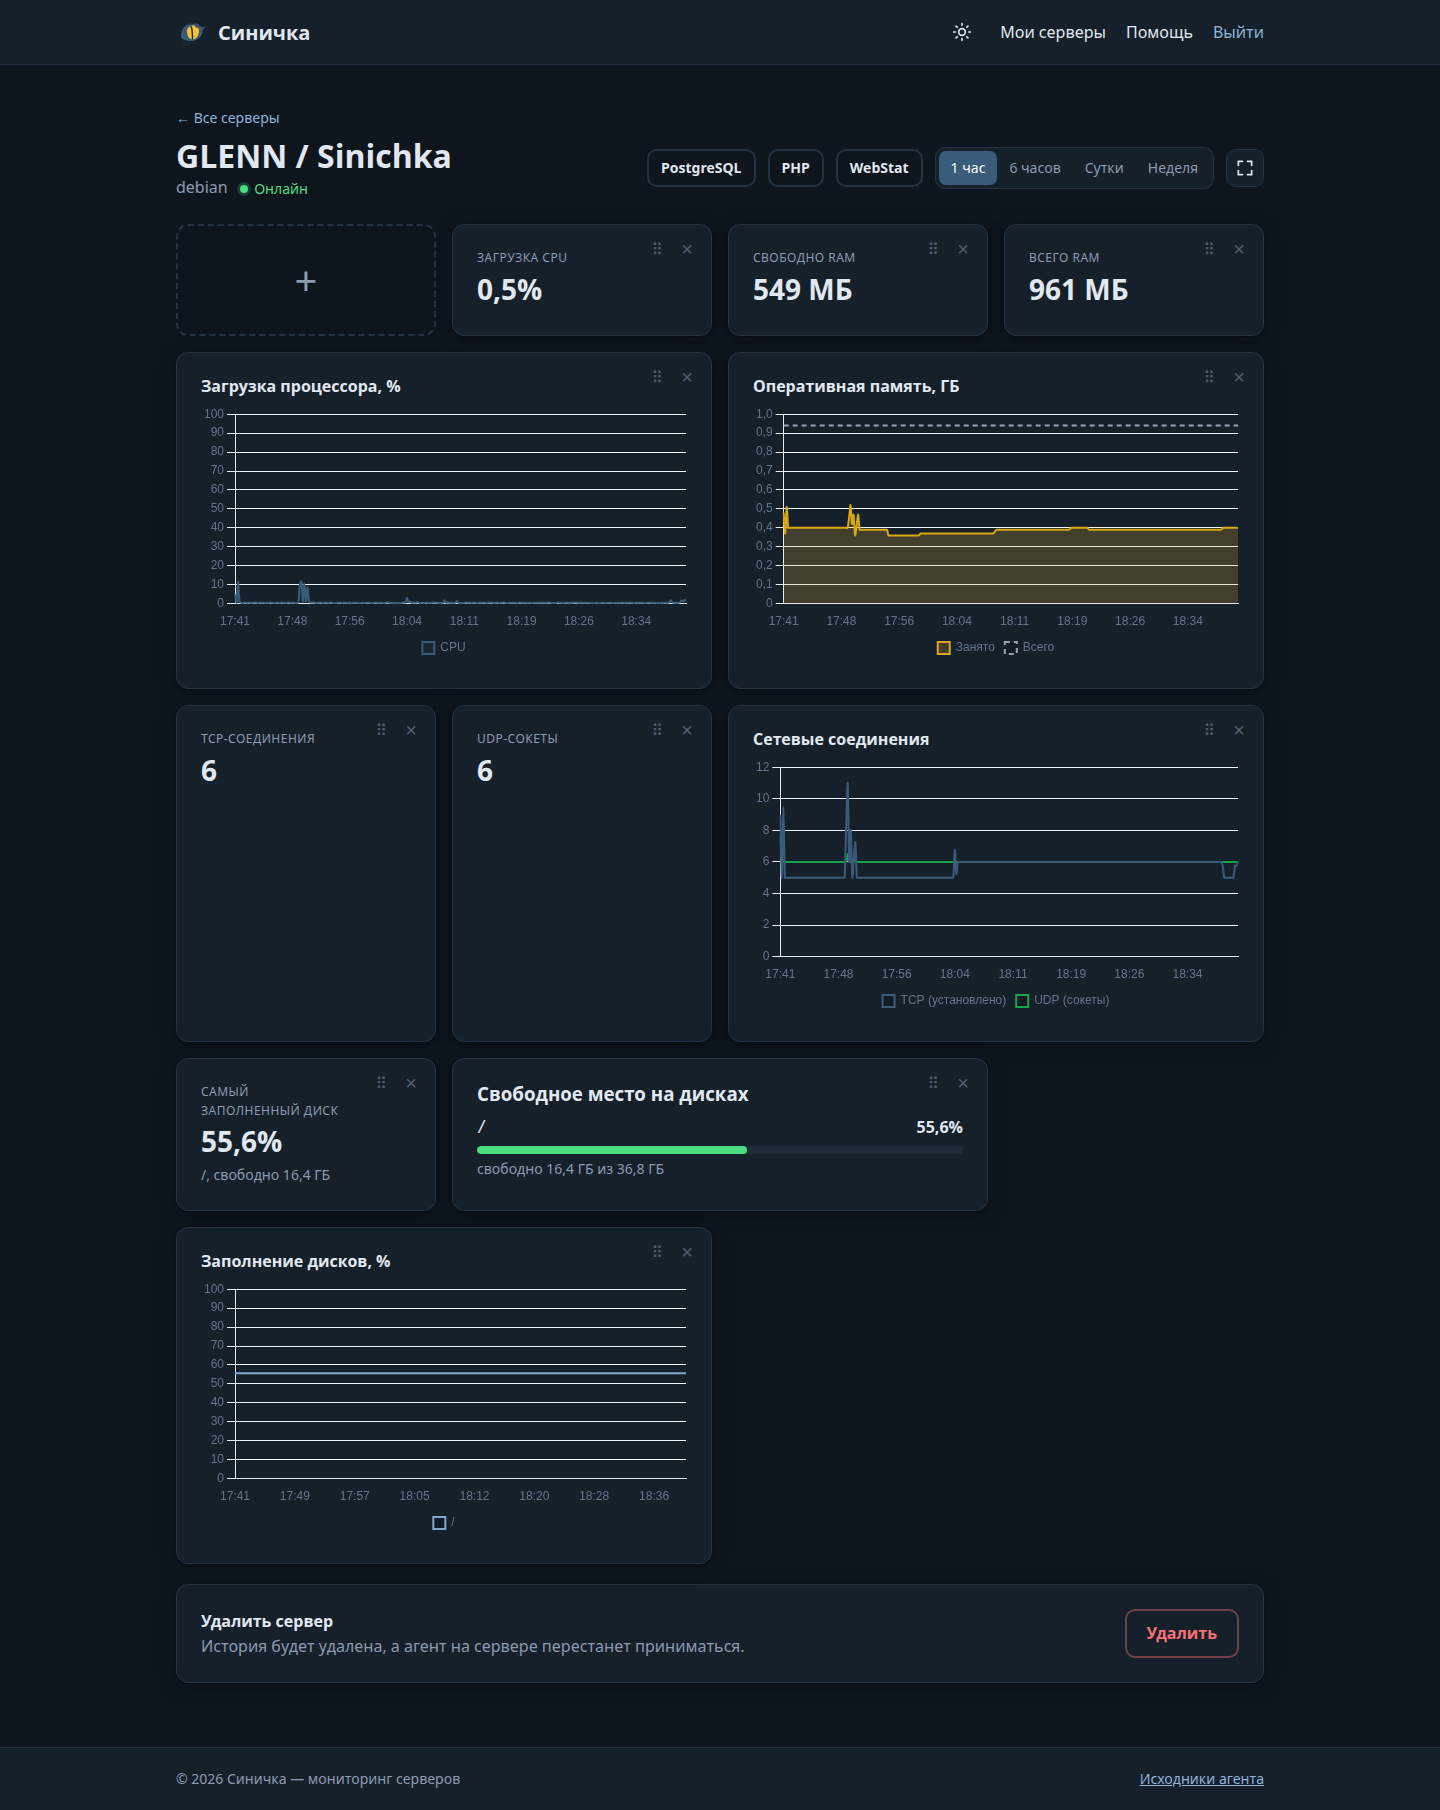
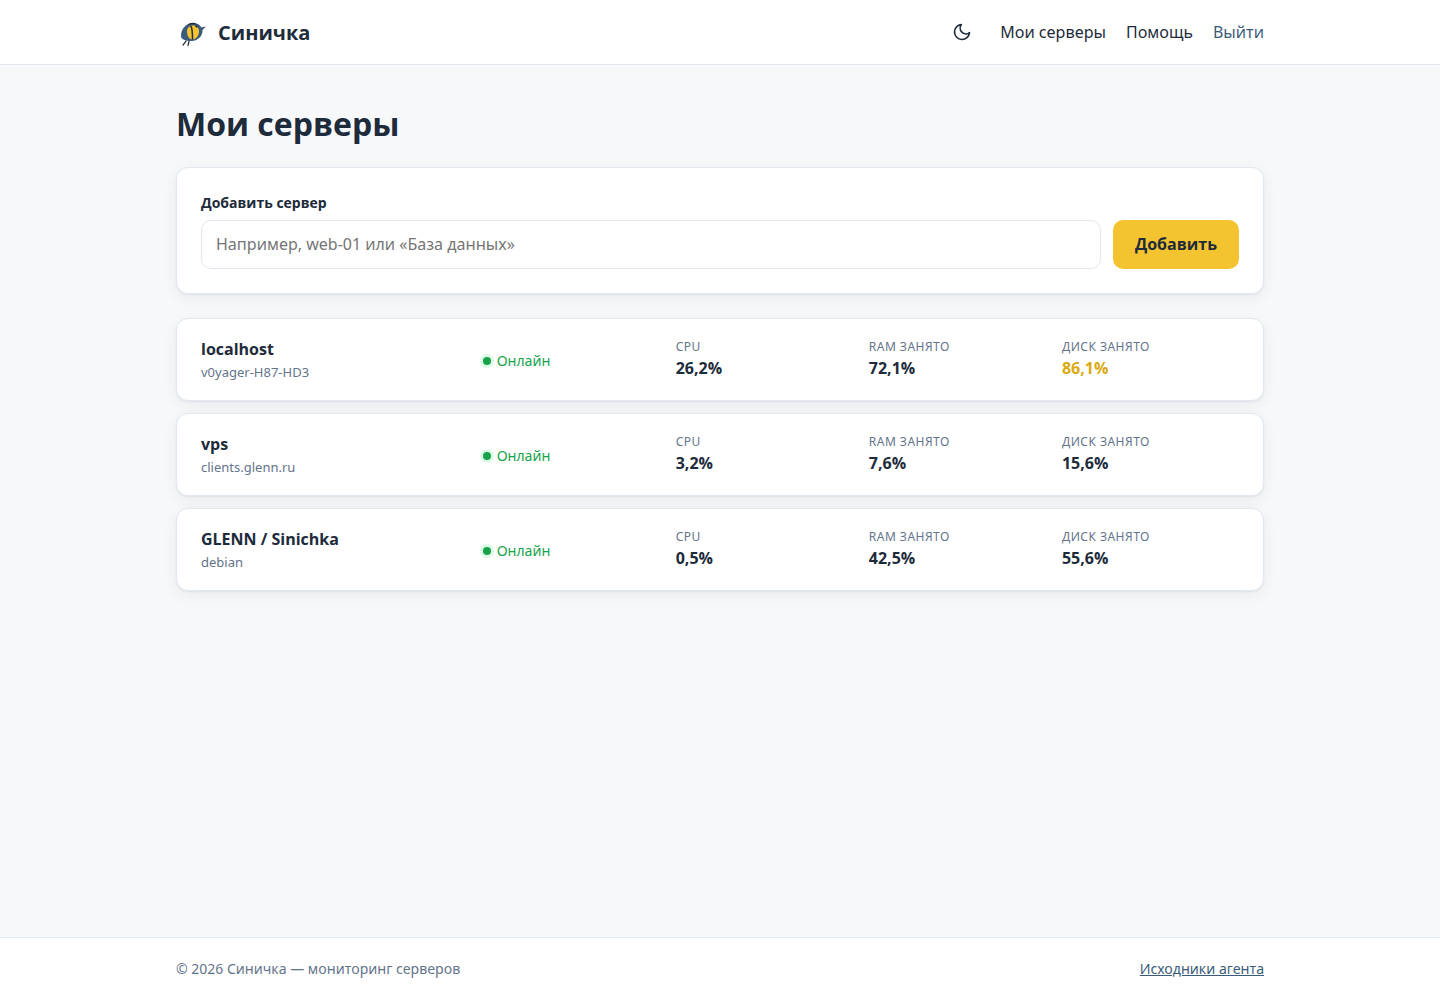
A Linux server monitoring service. A lightweight agent is installed on the client's server with a single command and sends metrics to sinichka.online, where they are shown on real-time charts in the personal account. A simple alternative to Zabbix and Prometheus when you need the essentials about your server right after installation.
Within the project we delivered:
- The sinichka-daemon agent in C++ with no dependencies (under 100 KB): every 3 seconds it reads /proc (CPU, memory, TCP/UDP connections), every 30 seconds — disk usage, and sends the data over UDP
- One-command installation
curl … | sh: the agent is built on the server, a systemd unit and a personal token for each server - A PHP CLI receiver: a long-running process accepts UDP packets, checks the token and a whitelist of metrics, writes history to PostgreSQL and cleans up outdated data itself
- A custom WebSocket server (RFC 6455) in the same process: new values reach the browser instantly without polling, access via signed HMAC tickets
- A personal account on the olala framework: a list of servers with online status, Chart.js charts for an hour, a day and a week
- A customizable tile dashboard: adding, hiding and dragging tiles (SortableJS), saving the layout for each server
- PostgreSQL monitoring: connections, long-running queries, transactions and queries per second, errors and slow queries from the log (the agent loads libpq dynamically)
- PHP monitoring: errors from logs and a hook for applications, grouping identical errors by fingerprint, with stack traces and repeat counters
- WebStat — an embeddable web analytics script: visitors, page views, clicks and traffic sources for sites on the server
- Kiosk mode (a full-screen dashboard for monitors), light and dark themes
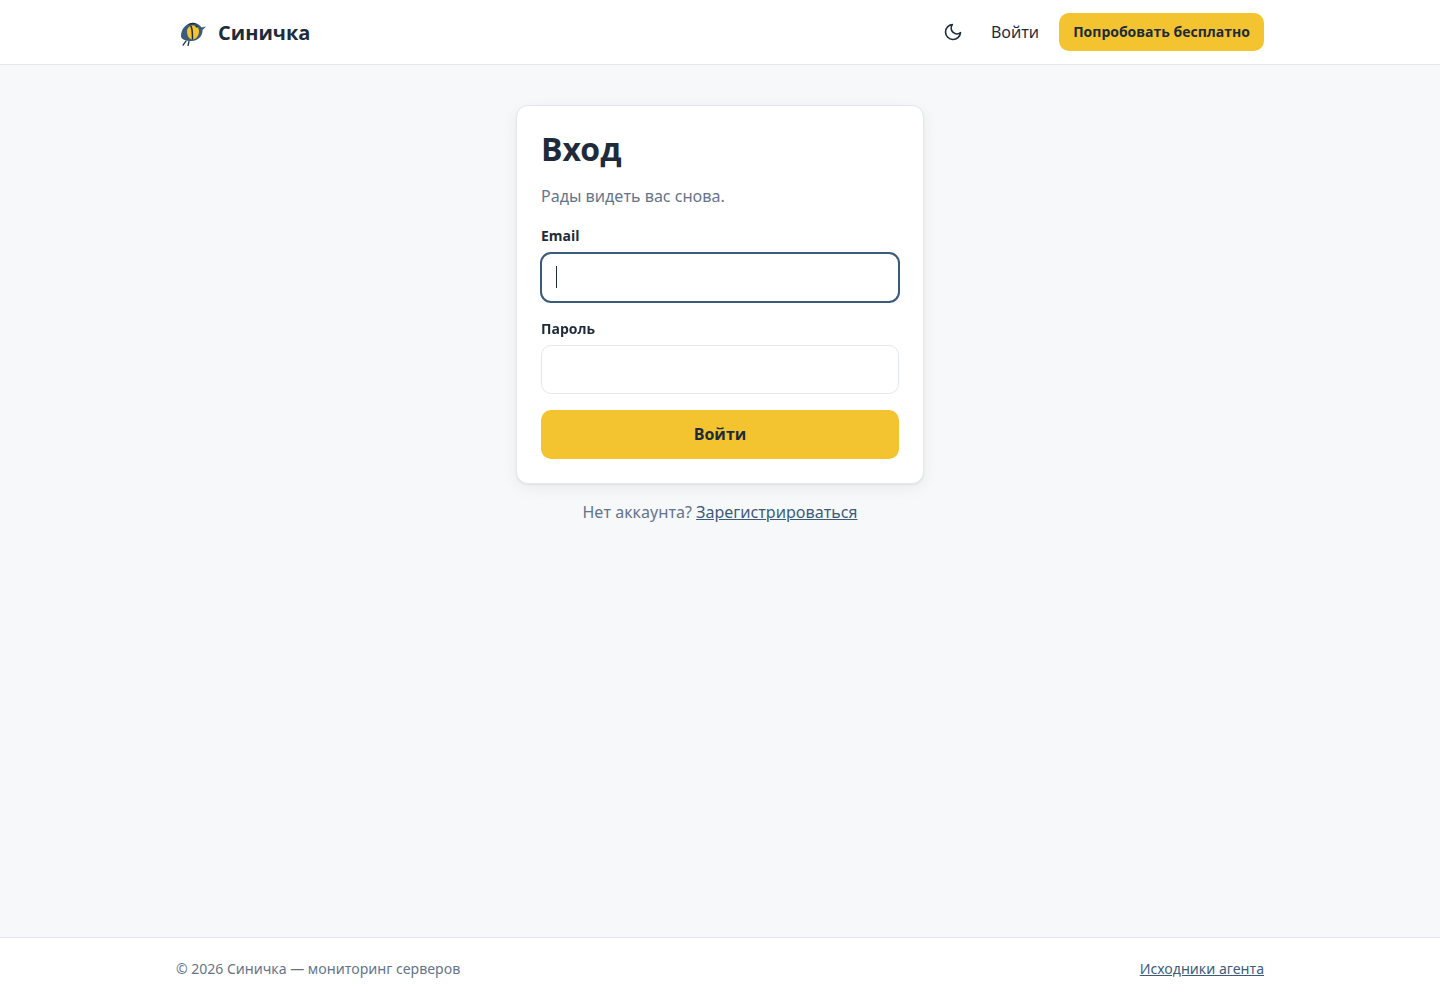
- A landing page, sign-up and login, a help section on installing and configuring the agent
visit website